Proposed Submission Core Strategy
3. 'PORTRAIT OF ROTHER DISTRICT'
Rother District
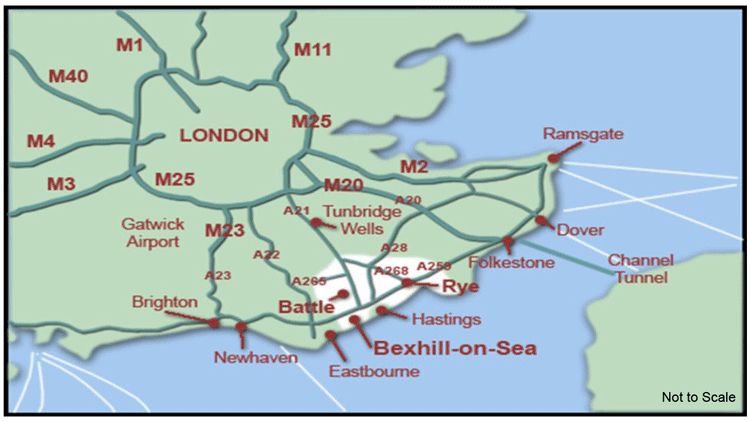
3.1 Rother district covers some 200 square miles and is a predominantly rural district. Figure 2 shows Rother in a regional context, the main settlements within Rother and the main road connections.
Population
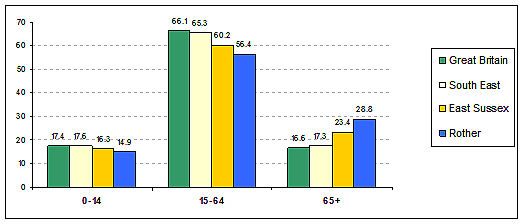
3.2 Some 89,987 people currently live in Rother (CACI, 2010), many dispersed across the rural area, but with nearly half being in Bexhill. There are a high proportion of elderly people, especially in Bexhill. The broad age structure of residents today is shown in Figure 3 below.
Living in Rother
3.3 Although not a wealthy area relative to other more affluent parts of the South East, Rother is an attractive and safe place to live. It benefits from a blend of some of the most beautiful countryside and coastline in South East England and contains the historic market towns of Battle and Rye, the Victorian/Edwardian seaside town (and administrative centre) of Bexhill and many picturesque villages.
3.4 Rother residents agree that the district is a good place to live. 86.2% of local residents indicate that they are satisfied with their local area as a place to live compared to 82.8% in the South East and 79.7% nationally. (Rother Place Survey 2008/09).
Environmental Conservation and Flood risk
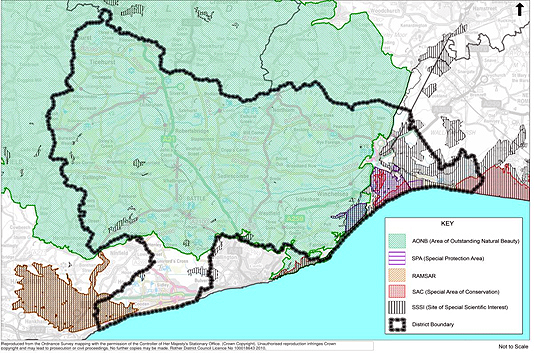
(1) 3.5 The importance of the environment is evidenced by the extent of the district, some 82%, designated as ‘Area of Outstanding Natural Beauty’ (AONB), while a further 7% of the district not in the AONB, is either nationally or internationally designated for its nature conservation value. Rother also has a number of Conservation Areas and local heritage plays a large part in tourism.
3.6 The Pevensey Levels straddling the south western boundary of the district is a ‘Ramsar’ site, designated for its international importance as a wetland habitat. In the south east, a ‘Special Protection Area’ (SPA) between Dungeness and Pett Level is of European importance for wild birds, while an area between Dungeness and Pett Level is designated as a ‘Special Area of Conservation’ (SAC), in recognition of its flora and fauna. There are also a number of Sites of Special Scientific Interest (SSSIs) in Rother. Figure 4 shows the extent of these environmental designations.
3.7 A recent review of the extent of Ancient Woodland shows that this is also significant, covering over 15% of the district – the greatest of any district in the South East (see the Ancient Woodland Inventory, 2010). This is of ecological as well as cultural and landscape importance.
3.8 The low-lying and coastal nature of the district makes it particularly vulnerable to flooding. The predominant key flood risk comes from the sea. The majority of the coastal perimeter benefits from flood defences which help reduce the threat of flooding within the district. Mapping of flood risk areas is contained in the Council’s Strategic Flood Risk Assessment.
The Local Economy
3.9 The economy is weak relative to the region as a whole, and average local incomes correspondingly low. In part, this is a reflection of the poor economic conditions of neighbouring Hastings which, together with most of Rother, forms a ‘Travel to Work Area’1 (TTWA). The Hastings and Rother area has one of the weakest economies in the South East. This is most graphically highlighted by the low level of economic productivity (Gross Value Added) of local businesses, being only 68% of the regional average.
3.10 The recent recession is likely to have a considerable impact on the district as a whole, particularly as the area starts from a relatively weak base. For example, figures show that there has been an increase in the numbers claiming out of work benefits (such as Job Seekers Allowance and Lone Parent Income Support) since 2009. There has also been a considerable decease in the number of housing developments completed within the district.
(1) 3.11 There has long been a high reliance on jobs outside the district, with net out-commuting of 5,824 workers (2001), equivalent to 17.2% of the workforce. Conversely, Rother has the highest proportion of people work at or from home than in any other district in the South East.
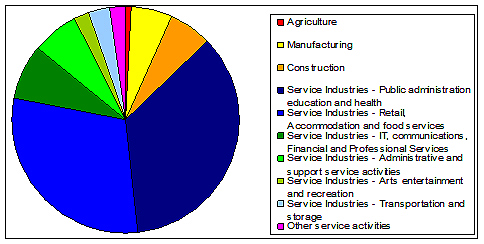
3.12 The economically active rate within the district is low at 75.4% compared to 79.1% for the South East (Annual Population Survey/Labour Force Survey, 2010). The service industries make up a significant proportion of the employment within the district and account for 87.8% of jobs (Figure 5). The largest proportion of this service employment comes from public administration, education and health with 34% compared to 27.3% in the South East (UK Industry Employment SIC, 2009, ONS).
3.13 In 2010, mean gross weekly earnings (by place of work) in Rother at £471 were 24.6% lower than earnings in the South East. Unemployment in Rother in December 2010 as measured by Job Seekers Allowance (JSA) claimant rate stood at 2.9%, against the South East average of 2.4%. The claimant rate in Rother has decreased since January 2010 when it stood at 3.3%.
Affordability of housing
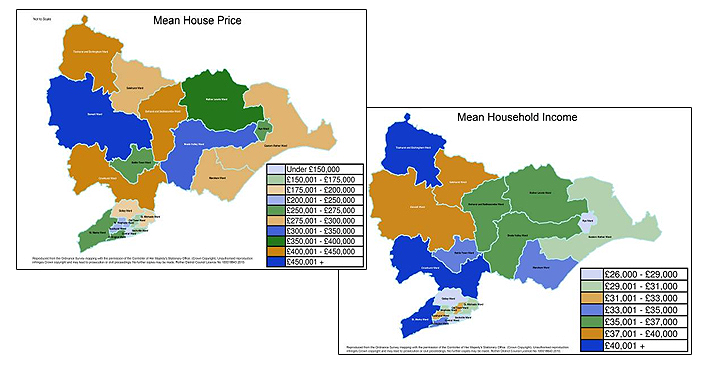
(1) 3.14 Low earnings combined with the area’s high house prices result in real difficulties of housing affordability, especially for younger people. In 2009, mean affordability ratios suggest that house prices were 5.31 times the average income within Rother. This contrasts with a South East affordability ratio of 6.78 and is lower than the ratio for Rother in 2002, of 5.36 times. Figure 6 shows average household incomes and mean average house prices by ward.
(1) Figure 6: Maps showing mean average household incomes & mean average house prices by ward (Hometrack 2009)
Social Characteristics
3.15 The 2010 Index of Multiple Deprivation gives an overall rank for Rother of 132 out of the 354 English local authorities, with the most deprived local authority ranked as 1. Rother has seen a fall in the ranking since 2007, when Rother was ranked 163.
3.16 Rother has a much higher proportion of owner occupancy and a much lower proportion of social housing compared to the national, regional and county averages. In Rother, 77.9% of households are owner-occupiers and just 11.5% social rented. Equivalent figures elsewhere are: England & Wales (68.9%/19.2%), South East (74.0%/14.0%) and East Sussex (75.1%/11.9%).
3,17 Educational attainment is generally above the national average but below that for the South East region.
Accessibility
(2) 3.18 Accessibility within the district is generally poor, particularly in terms of road and rail journey times to London and to regional centres such as Ashford and Brighton. These poor links disadvantage the district in economic terms.
3.19 A comprehensive picture of the district is contained in ‘Rother in Profile’ (2009). Other key references are: LSP Action Plans’ indicators, the LDF Annual Monitoring Report, the Council’s Performance Plan, the ‘Integrated Regional Framework’, and 'East Sussex in Figures' database.
Demographic trends
(1) 3.20 Based on housing growth proposed between 2011 and 2028, the population in Rother is predicted to increase by 0.86%. As Figure 7 shows, it is the older age cohorts that are forecast to increase most in the future.
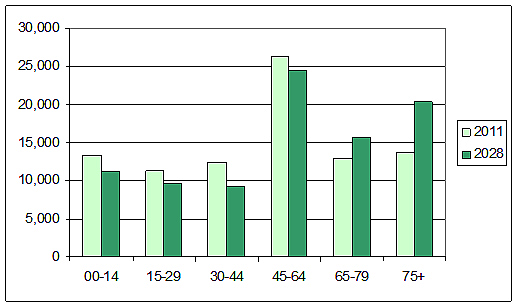
(2) 3.21 Population projections suggest that Rother will see some major changes in terms of its population structure between 2011-2028. The district is forecast see large growth (49.4%) in the over 75 proportion of its population by 2028, and an increase in those aged 45-64 (21.7%). There will be a large reduction (-25.9%) in the population of the 30-44 age group, along with those aged 15-29 (-14.8%) and 0-14 (-15.8%). Of course, these trends may be influenced by factors such as the scale, location and form of development and any changes in relative economic circumstances.
(1) 3.22 The district’s average household size, which is already one of the lowest in the region, at 2.17 persons (ranking 64th of the 67 local authorities in the South East) (2001) this is set to reduce further to 2.12 by 2016 and to 2.08 by 2026.
1 Travel-to-Work Areas (TTWAs) are used to detail areas which have self-contained labour markets